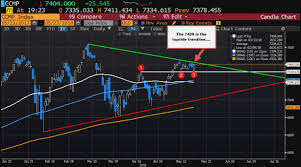
Get the live stock charts of all world markets including NASDAQ INDEX,NASDAQ STOCKS FTSE 100 INDEX, FTSE STOCKS, BSE/NSE INDEX, NSE OR BSE STOCKS technical charts, live market map and more technical stock information at Stock Market Profits blog
Type your stock of any country or index (of any country) of your choice in top-left box and get your stock's or index's live technical chart. For example, in place of the default ndaq (nasdaq inc.), you can type "facebook" -- it's code get's displayed in the drop-down list automatically - you can click on the desired code of the displayed list to get it's chart.
You can add technical indicators like Bollinger Bands, MACD, MACD Histogram, RSI, CCI, etc. of your choice to the displayed chart.
You can choose various time-frames also, like 1-minute, 5-minute charts for intraday trading and daily, weekly and monthly time-frames for short-term or long-term trading.
Technical Charts: Real time and intraday charts for for all market through out globe, including NASDAQ INDEX, FTSE-100 INDEX, NASDAQ STOCKS, FTSE STOCKS, NSE, BSE Stocks/
To assess the nearby resistance levels in an uptrend and support levels in a downtrend, check the Pivot Calculator -- it gives you a clear idea of next level in your trading.
In the same way, if you wanna get next levels of price movement in the live trading, check your Finonacci Calculator -- it gives you next up price before retracement or correction in an uptrend and also the next down price before retracement or correction in a downtrend.
So, why to wait... Go ahead to get your technical charts before trading.
Stock markets live stock charts give you live data to render you a free-hand to decide which stock / index to buy or sell in an appropriate time.


0 Comments